


Explore Robert G. Allen’s unconventional wisdom for wealth creation and success-driven mindset in personal finance in this blog article!

Discover the secrets behind Sir John Templeton, a famed value investor and his successful investing journey in this article!

Metaverse redefines human interactions, merging physical & digital worlds. Explore its essence, state & future potential in this article!
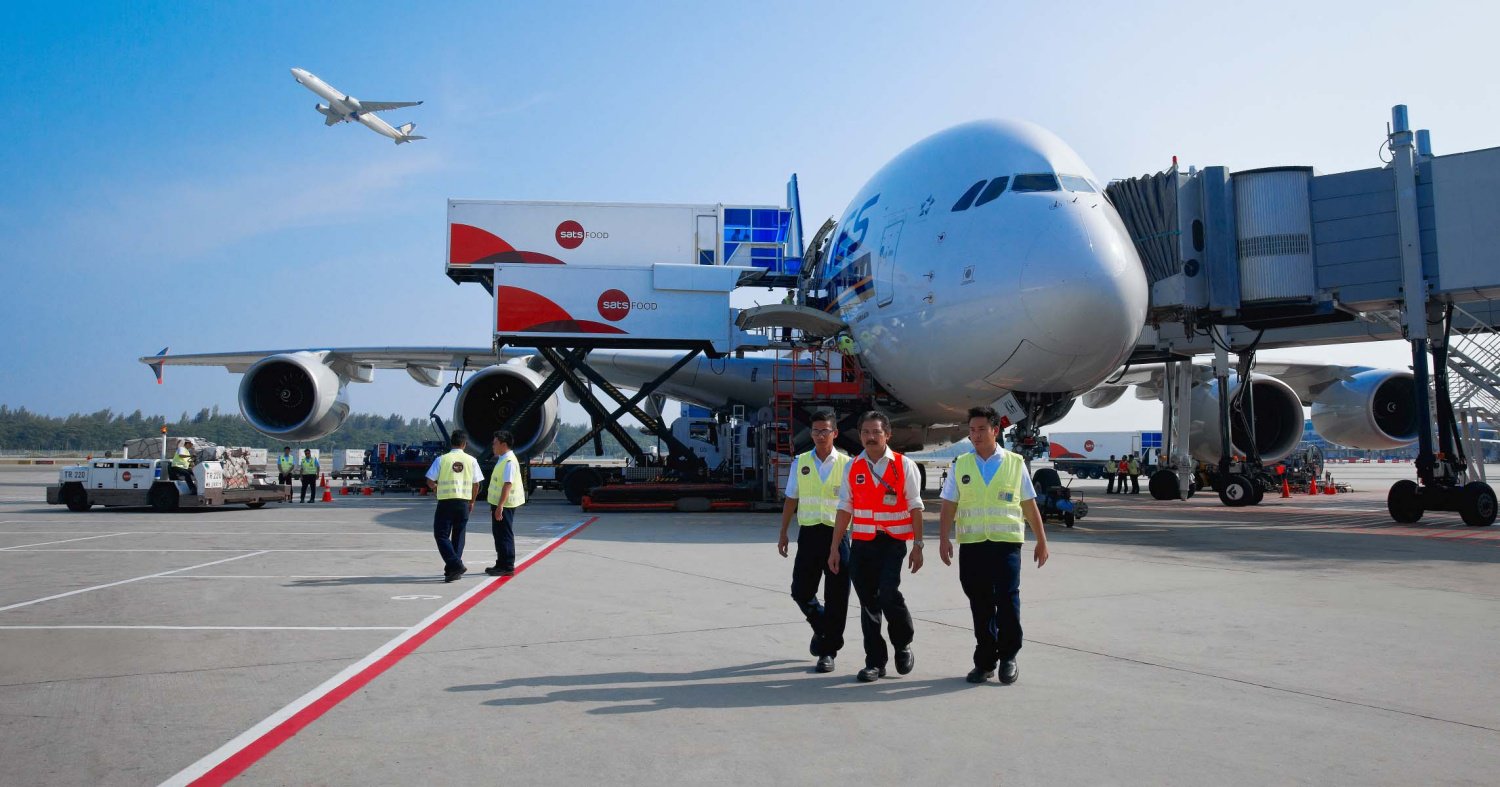
Singapore Airport Terminal Services, also known as SATS Ltd. is Asia’s leading airport service provider, based in Singapore. It currently controls 80% of aircraft ground handling and catering services in Singapore’s Changi Airport.

Welcome to ViA Atlas by Value Investing Academy, the Official E-Learning Resource Portal for Value Investing. Get Started With A Free Membership Today!