HOW THE COMPANY MAKES MONEY
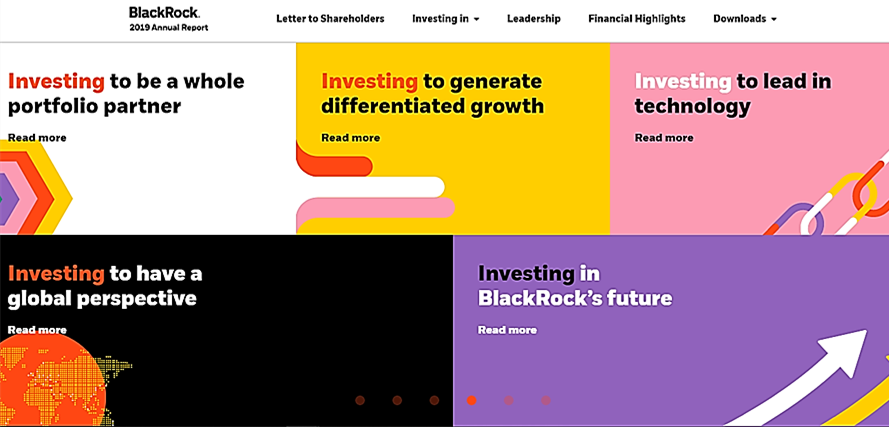
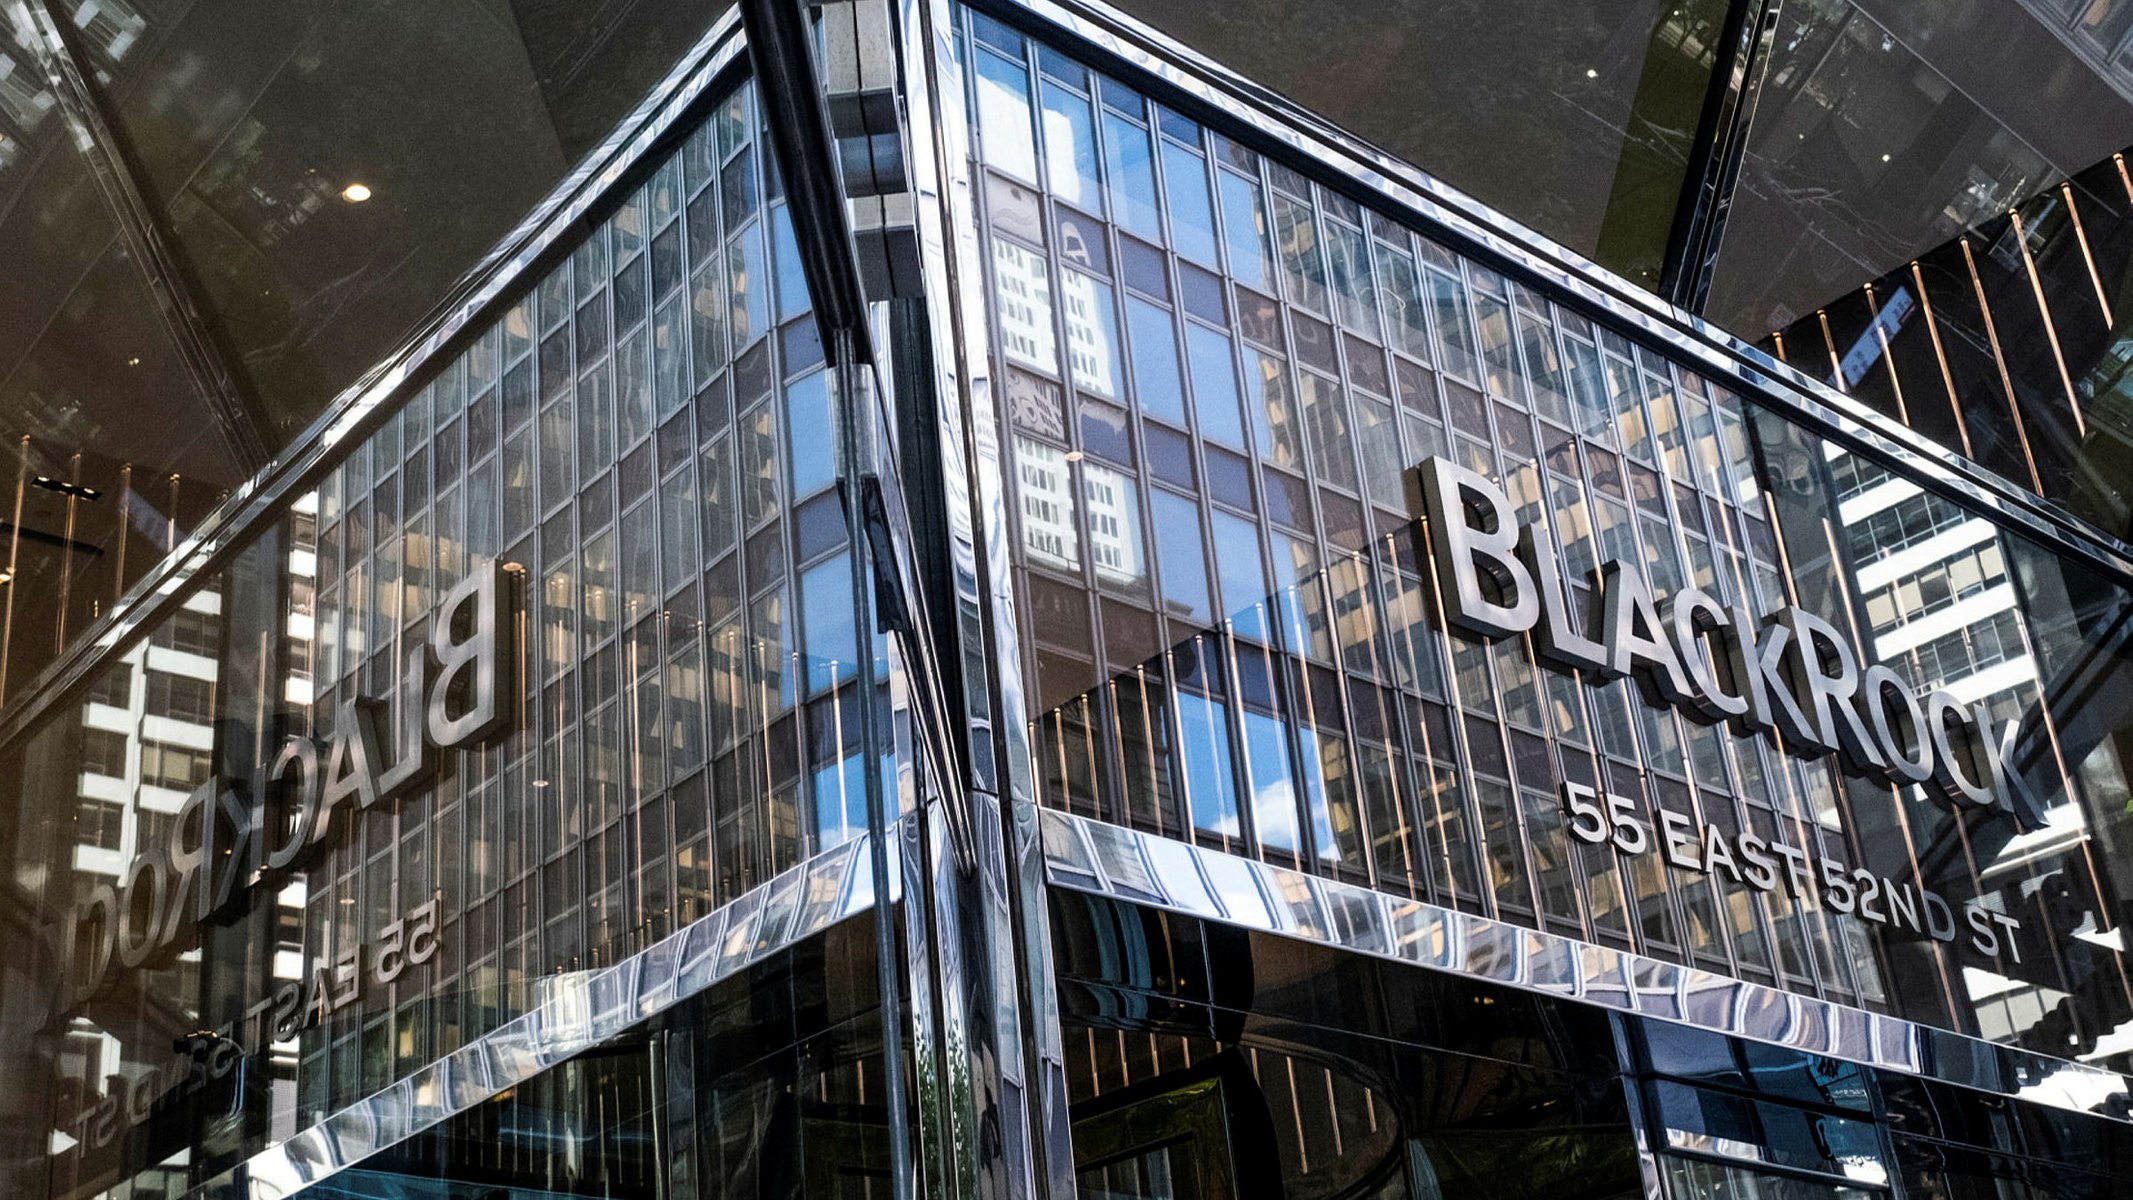
BlackRock Inc. is one of the famous investment management company and this company provides variety of services to their clients located worldwide. Due to the nature of their investment business, they are able to tailor-made portfolio by taking into account the different asset classes as well as active (alpha) and index (beta) strategies. The asset classes which are available for tailor-made portfolio management include money market instruments, fixed income, equities and alternative income. They offer the investment solutions to their client via instruments vehicles such as iShares ETF (exchange-traded funds), open-ended mutual fund, separate account, closed-ended mutual fund, collective investment funds and others. They too have in-house investment system known as Aladdin investment system that has built-in risk management service, advisory service, outsourcing service, technology service and many more. BlackRock Inc. was listed for public offering during the height of dot-com bubble era in 1999 via ticker symbol ‘BLK’ (NYSE) and has current market capitalization of USD 107.67 billion while also being part of S&P 500 index. The following screenshot shows the main webpage of BlackRock Inc. 2019’s Annual Report:
Would you like to attend a LIVE online session on a detailed analyst of a good growth, fair valued U.S Company?
Here’s the link to attend our next webinar.
WHAT’S ONE THING UNIQUE ABOUT THIS COMPANY
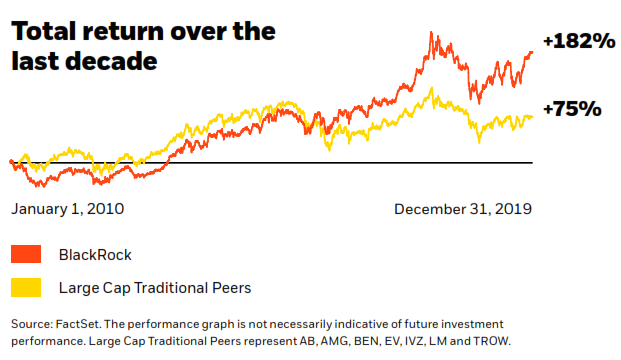
As mentioned earlier, they provide various services to their clients and it is stated in their report that should their client invested $10,000 in 2009, they would receive a return of $30,000 in 2019. Similarly, if they invested $10,000 for four decades, the return would have been $200,000; hence solidifies the power of investing with BlackRock Inc. The following lists the solutions they provide as extracted from 2019 Annual Report:
- Sustainability
- Whole Portfolio Solutions
- Diverse Investment Platform
- Portfolio Construction & Risk Management Technology
- Thought Leadership
The following diagram shows the assets under management of BlackRock Inc. and the proportion of assets which are being managed as of 2019:
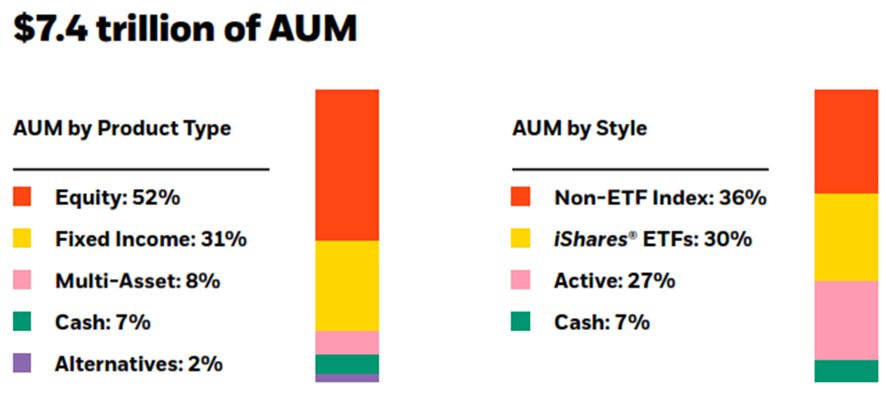
(Source: Extracted from 2019 Annual Report)
REVENUE TREND
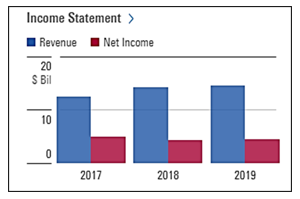
Over the years, BlackRock Inc. has been performing well from the perspective of revenue as can be seen in the figure below. In 2017 for instance, revenue was clocked in at USD 12.49 billion and it grew to USD 14.20 billion in 2018 and USD 14.54 billion in 2019, thus reflecting a jump 116% over the course of two years. The operating income also showed a similar trend whereby in 2017, USD 5.27 billion was reported and it went up to USD 5.6 billion in 2018 and USD 5.64 billion in 2019. Their net income however showed mixed results whereby in 2017, it was reported to be USD 4.97 billion and it went to USD 4.31 billions of dollars in 2018 and USD 4.48 billions of dollars in 2019.
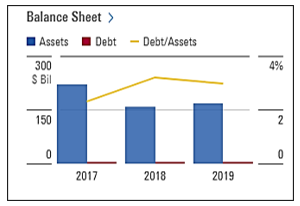
Apart from income statement, BlackRock’s balance sheet also appears solid whereby in 2017, the asset was reported to be USD 220.22 billion and this figure went to USD 159.57 billion in 2018 and grew to USD 168.62 billion in 2019. The same pattern was too observed in liability whereby in 2017, it was reported to be USD 188.34 billion and it went to USD 127.14 billion in 2018 and increased to USD 135.01 billion in 2019. Looking at their debt profile, it is interesting to note that it is rather consistent whereby in 2017, it was reported USD 5.01 billion and it was reported to increase marginally to USD 5.06 billion in 2018 and USD 4.96 billion in 2019. The following diagram summarizes the balance sheet across the years:
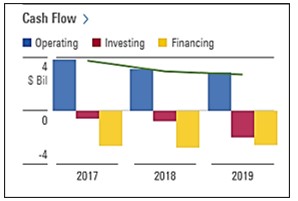
Moving on cash flow, it was shown that USD 3.83 billion of operating cash flow was reported in 2017, followed by USD 3.08 billion in 2018 and USD 2.88 billion in 2019. The same trend was observed in their investing cash flow whereby in 2017, it was reported to be USD (0.59) billion and it went to USD (0.81) billion in 2018 and subsequently to USD (2.01) billion in 2019. Similarly, financing cash flow was reported to be USD (2.63) billion in 2017, followed by USD (2.77) billion in 2018 and USD (2.58) billion in 2019. From the Free Cash Flow perspective, it was reported to be USD 3.67 billion in 2017, followed by USD 2.87 billion in 2018 and USD 2.63 billion in 2019.
EARNINGS PER SHARE TREND
WHAT TOOK PLACE IN THEIR PERFORMANCE RECENTLY?
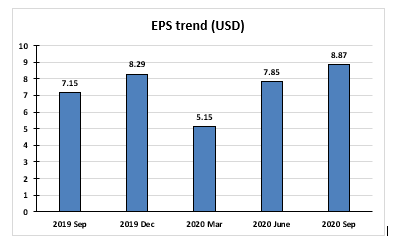
- The diluted EPS was reported to be USD 8.87 (increment of 24%) while the adjusted EPS was reported to be USD 9.22 (increment of 29%)
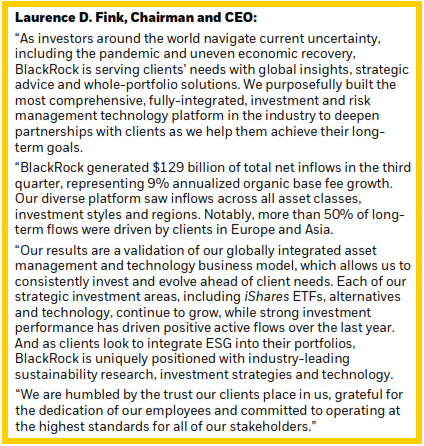
- The quarterly net inflow was reported to be USD 129 billion which was supported by increased momentum in fixed income and cash management
- Organic asset growth was reported to be 7% annualized mainly in products such as illiquid alternative, active equities, and iShares areas
- Increase in revenue was reported at 18% based on year-on-year basis
- Increase in operating income was reported at 17% based on year-on-year basis
- The net flow in third quarter came mostly from America ($41 billion), followed by Asia Pacific ($32 billion) and Europe ($25 billion)
- Revenue from investment advisory, security lending was reported to be USD 245 million
- The fee charged on performance was reported to be USD 441 million based on year-on-year basis
- The revenue from Aladdin system was reported to increase by USD 23 million
- Employee compensation and benefits expense was reported to be USD 300 million based on year-on-year basis
DISCLOSURE
The above article is for educational purposes only. Under no circumstances does any information provided in the article represent a recommendation to buy, sell or hold any stocks/asset. In no event shall ViA or any Author be liable to any viewers, guests or third party for any damages of any kind arising out of the use of any content shared here including, without limitation, use of such content outside of its intended purpose of investor education, and any investment losses, lost profits, lost opportunity, special, incidental, indirect, consequential or punitive damages resulting from such unintended use.


