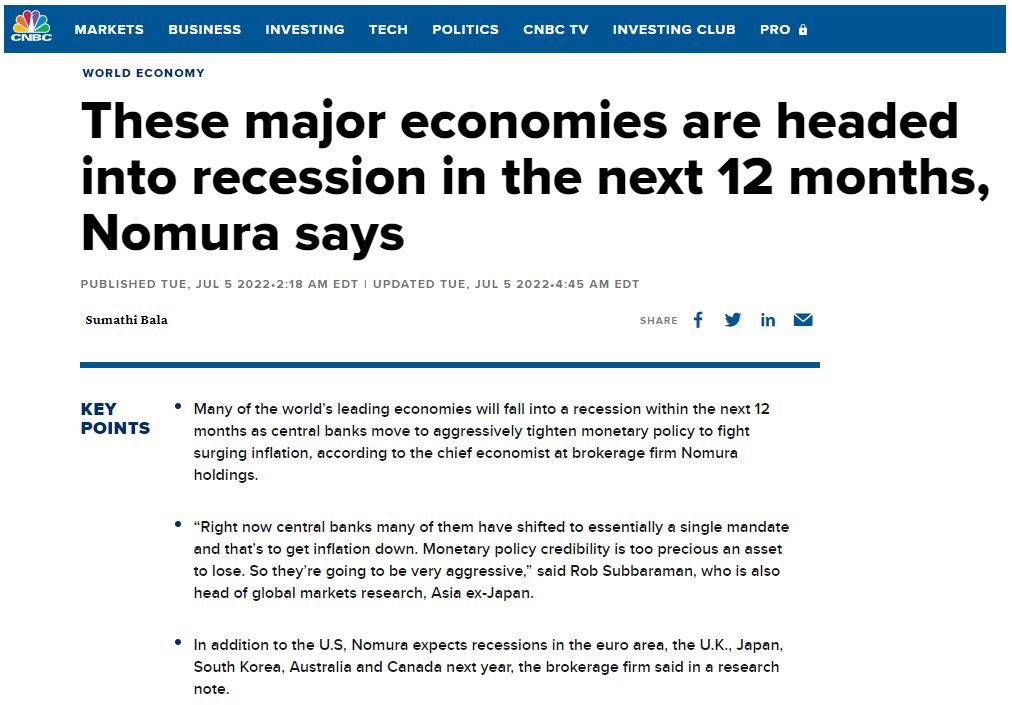
News about the bear market landed in the US markets in June 2022 has grabbed worldwide attention and triggered recession fears among public. Various news channels have been blasting horrifying headlines, predicting the recession to hit major economies next year.
Pessimism about the global economic outlook had boosted demand among investors to search frantically for safe-haven opportunities to protect their wealth from the bear market onslaught. As investors, we want to make sure that our investments and money in the stock market are well-protected.
Thus, in order to find a recession-proof stock, we need to know firsthand which sector or industry is considered recession-proof and a safe haven to protect our wealth from the impending recession?
In this blog, we will be exploring the different sectors and industries within S&P500 that are considered recession-proof based on historical performance data.
WHAT IS A RECESSION?
Before we get started, let’s understand what a recession is.
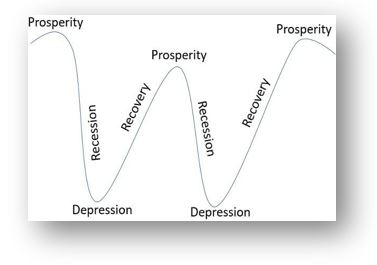
According to the definition by National Bureau of Economy Research, a recession is defined as a significant decline in economic activity that is spread across the entire economy and lasts for more than a few months. This means that between the peak of economic activity, followed by a significant decline that reaches the lowest point of the economic activity, that particular period is known as a recession.
Nevertheless, why is everyone afraid or worried about the recession?
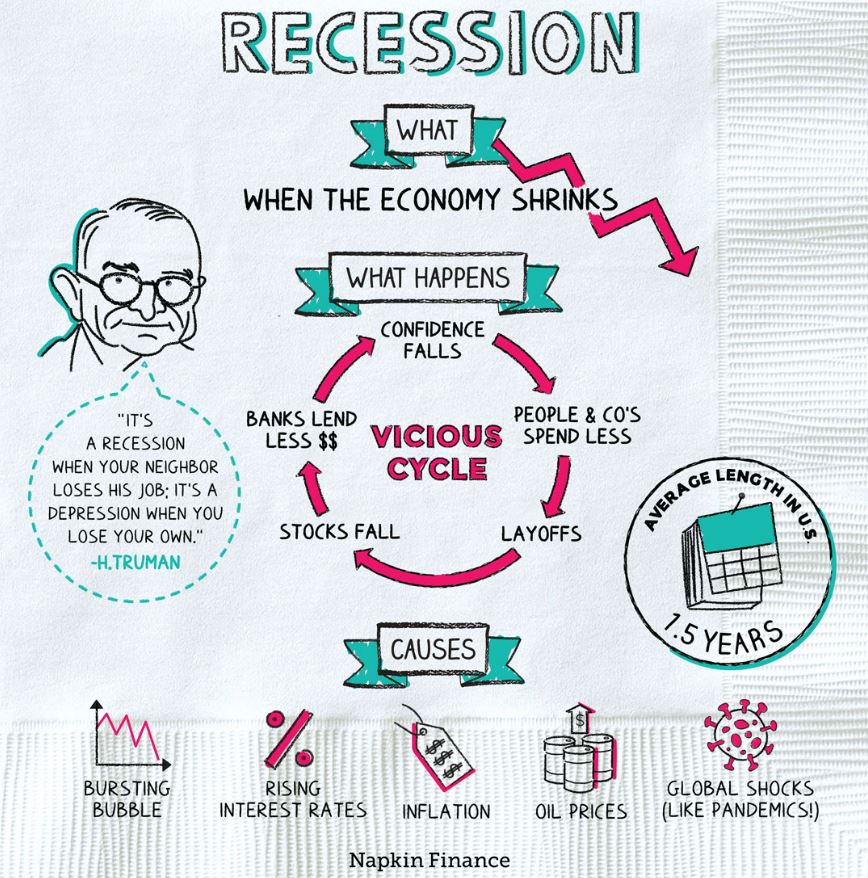
This is because the recession will severely impact the economy, businesses, and employment which was illustrated in the diagram below:
Now that we know what a recession is, is there a difference between a recession and a bear market?
BULL AND BEAR MARKET
A Bear market happens when the stock market has fallen at least 20% from its previous high, but when the stock market rises at least 20% from its previous low, this is known as a Bull market.

In the last few decades, we have experienced a few Bull and Bear markets. The average lengths of Bull markets are about 55.1 months and Bear markets are 11.7 months based on historical data.
From the chart below, it illustrates the historical performance of the S&P500 index during the US Bull and Bear markets from 1957 to 2018.
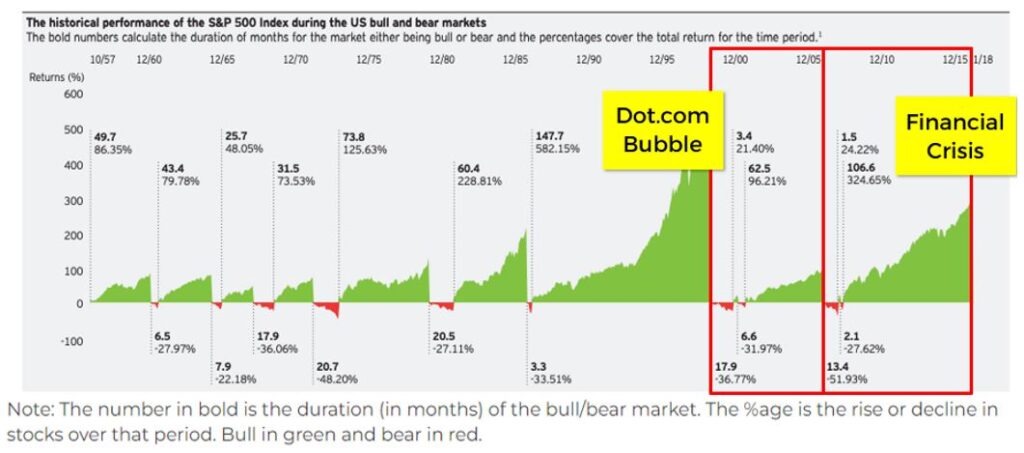
We observed that during the Dot.com Bubble and ‘08-‘09 Financial Crisis, the Bear market (shown in red) lasted about a total of 24.5 months and 15.5 months respectively, then followed by a strong Bull market that each lasted for about a cumulative of 65.9 months (Dot.com Bubble) and 108.1 months (Financial Crisis).
For the past few recessions, we noticed a similar trend after every Bear market, it will be followed by a recovery period, known as the Bull market. However, a Bear market is not necessarily a recession, but it can be a predictable indicator that a recession is coming.
Thus, how can we protect our wealth and investments during the Bear market?
Before we find out the answer, let’s learn one of the commonly used benchmarks of the US stock market, which is the S&P 500.
WHAT IS S&P 500 INDEX?
The stock index is a collective performance measurement of public stocks listed in the US stock exchange, such as the S&P 500, Nasdaq and Dow Jones Industrial Average (DJIA).
As such, S&P 500 is the stock market index that tracks the stock performance of the 500 largest listed companies in the US stock market. The 500 publicly listed companies are categorized into different economic sectors according to the nature of the business. Thus, S&P 500 has been seen as the market standard as it represents almost 80% of the whole US stock market (as of Feb 2020) and many equity funds or indices were used to compare against it.
The two most popular ETFs that keep track of the S&P 500 index performance are SPDR S&P 500 ETF Trust (ticker symbol: SPY) & Vanguard 500 Index Fund ETF (ticker symbol: VOO). Although both ETFs have similar track records against the S&P 500, the main difference between these two indexes is the cost of owning the fund, which is known as the Expense Ratio.

WHAT IS THE DIFFERENCE BETWEEN SECTOR & INDUSTRY?
People may sometimes get confused about the difference between sector and industry as these two words were frequently used by market analysts and financial experts in the news. The diagram below shows the simplified explanation between the two words.

There are a total of 11 different sectors that span across the entire US economy in the S&P 500 index, which are:
- Energy
- Utilities
- Healthcare
- FInancials
- Industrials
- Real Estate
- Consumer Staples
- Materials
- Information Technology
- Communication Services
- Consumer Discretionary
Within each economic sector, they are further differentiated into different industries where businesses that offer similar goods & services are grouped together to form an industry. For example, in the Consumer Staples sector, companies that produce household products are categorized as one industry, whereas businesses that manufacture personal products are grouped into another industry (Scroll down to learn more about the Top 4 Recession-proof Sectors & Industries section!)
Now that we have a clearer understanding of the difference between sector & industry, let’s further deep dive into the past decades’ performances of the various S&P 500 sectors!
HISTORICAL PERFORMANCE OF S&P 500 SECTORS
The chart below illustrates the past performance of the annual return of S&P 500 sectors from 1990 to 2018. The green and red shading represent how well each sector performed in that particular year. The darker the colour of the shading, the better (green) or worst (red) performance of that sector for that year.
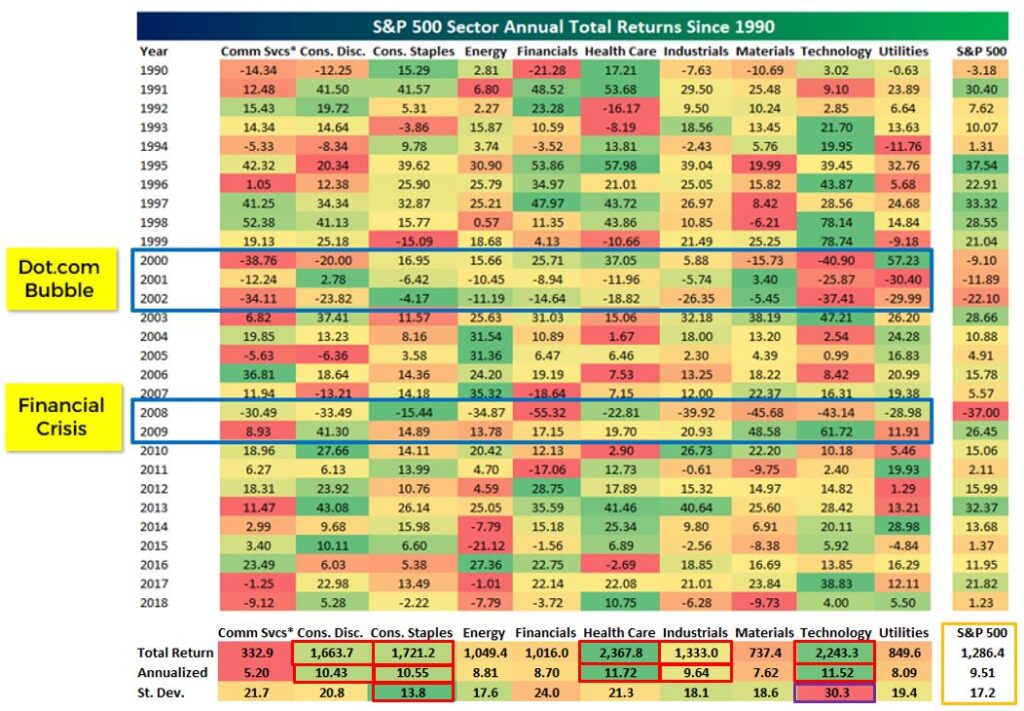
During the Dot.com bubble, the Technology sector had the worst performance, but the Materials & Consumer Staples sectors are performing slightly better than the rest of the sectors. In the 08-09 Financial Crisis, the Financials sector has darker red shadings compared to the rest of the sector during that period. Nevertheless, Consumer Staples performed well in 2008 but Technology, Materials and Consumer Discretionary performed well in 2009.
From 1990-2018, the annualized return for the average of the S&P 500 is 9.51% (shown in the orange box). When we compared the annualized return across the 11 sectors, only 5 sectors performed better than the average mark of 9.51%, which are Health Care, Technology, Consumer Staples, Consumer Discretionary and Industrials.
Standard deviation refers to the share price volatility of the sectors during 1990–2018, which means the highest point and lowest point share price difference recorded during that period. Even though the Technology sector has the higher annualized return between 1990–2018, it also has the highest standard deviation or price volatility.
This implies that the share price for that sector can be like a roller coaster ride, some of the years have the best performance returns but other years will encounter a sudden plunge in share price.
Among the 11 sectors, Consumer Staples has the lowest standard deviation recorded as we will see in the later part of the article that the share price of the Consumer Staples ETF has been fairly stable throughout the decades. The remaining 10 sectors have a higher standard deviation than the S&P 500 average (17.2).
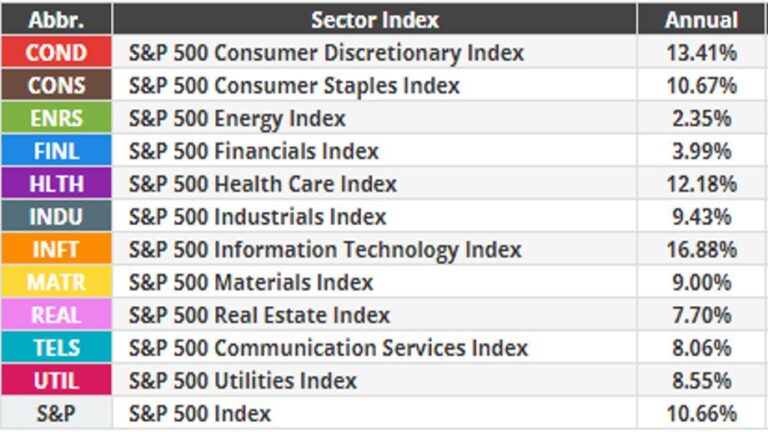
The chart above shows the latest annualized return for the various S&P 500 sectors from 2007 to 2021. In the chart, the annualized return for the average of the S&P 500 is 10.66%. When we compared the annualized return across eleven sectors, only four sectors are above the 10.66% mark. They are Consumer Staples, Health Care, Consumer Discretionary, and Information Technology.
CRITERIA OF A RECESSION-PROOF INDUSTRY
A recession-proof industry is also known as a recession-defensive industry, which means that the industry is not severely affected by the sudden change in prices or incomes during an economic downturn. For an industry to be recession-proof, there are a few criteria that need to be met:
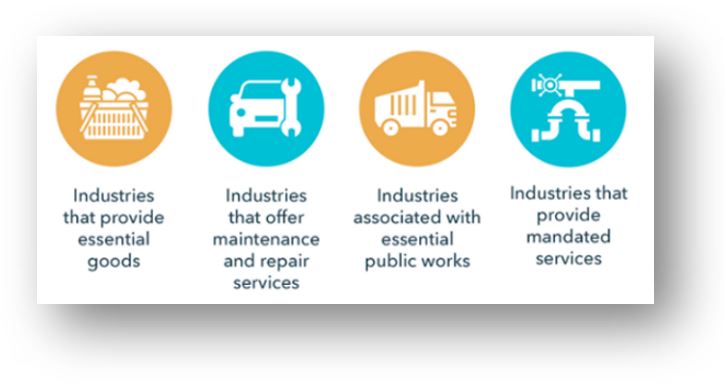
From the criteria listed in the diagram above, we can deduce that a recession-proof industry has inelastic demands. This means that no matter how abrupt the changes in products & services prices or consumer’s income, the consumer demand for these necessities remain relatively stable as people need these to get on with their daily lives. They are unable to wait for the economy to improve before they decided to spend money on them.
However, a recession-proof industry may be stable during an economic downturn, it is not necessarily a boomer or fast-growth industry during a bull market. In addition, different causes of recessions will affect different industries. For example, during the Dot.com bubble, the IT sector was the worst-hit sector during that period, but during the ‘08-‘09 Financial Crisis, it was the Financial sector that had the hardest hit.
TOP 4 RECESSION-PROOF SECTORS & INDUSTRIES
After we have explored the 11 main sectors in the S&P 500, we will further deep dive into 4 sectors that have been shown to have higher annualized returns when compared against S&P 500 index (10.66%).
1. CONSUMER STAPLES (ANNUALIZED RETURN 10.67%)
- SPDR S&P 500 Consumer Staples ETF – XLP
- Vanguard S&P 500 Consumer Staples ETF – VDC
For the Consumer Staples sector, it is made up of 6 main industries:
- Beverages
- Food & Staples Retailing
- Food Products
- Household Products
- Personal Products
- Personal Products
- Tobacco
The companies within this sector provide all necessities of life that people need daily, and they manufacture products that people regularly see in stores. Some of the companies’ examples are:

2. HEALTH CARE (ANNUALIZED RETURN 12.18%)
- SPDR S&P 500 Health Care ETF – XLV
- Vanguard S&P 500 Health Care ETF – VHT
Health Care sector, is also comprised of 6 industries:
- Biotechnology
- Health Care Equipment & Supplies
- Health Care Providers & Services
- Health Care Technology
- Life Sciences Tools & Services
- Pharmaceuticals
This sector aims to improve the human body or mind. It is mainly made up of companies that provide medical supplies, scientific-based operations or services, such as:

3. CONSUMER DISCRETIONARY (ANNUALIZED RETURN 13.41%)
- SPDR S&P 500 Consumer Discretionary ETF – XLY
- Vanguard S&P 500 Consumer Discretionary ETF – VCR
For this sector, it has a total of 11 industries:
- Auto Components
- Automobiles
- Distributors
- Diversified Consumer Services
- Hotels, Restaurants & Leisure
- Household Durables
- Internet & Direct Marketing Retail
- Leisure Products
- Multiline Retail
- Specialty Retail
- Textile, Apparel & Luxury Goods
From the list of industries, we noticed that the products and services are mostly considered ‘good to have’ or ‘luxury items’. Thus, the demand for these items in this sector depends on the economic condition and wealth of individuals.
However, some of the goods may be a necessity for certain groups of consumers. For example, a car is a necessity for salespersons or service engineers as they need to travel to the customer site to work or meeting.
Examples of the companies within this sector include:

4. INFORMATION TECHNOLOGY (ANNUALIZED RETURN 16.88%)
- SPDR S&P 500 Information Technology ETF – XLK
- Vanguard S&P 500 Information Technology ETF – VGT
In recent years, Information Technology has deeply embedded in our modern lives that forever changed the way how we live and interact. This is clearly observed during the Covid-19 pandemic where everyone is forced to work from home, using more technological devices in daily lives such as digital payment to minimize human touch interactions which may further spread the disease.
This sector focus on developing or distributing technological items or services, such as computers, microprocessors and operating systems. It is comprised of 6 industries:
- Communication Equipment
- Electronic Equipment, Instruments & Components
- IT Services
- Semiconductors & Semiconductor Equipment Software
- Technology Hardware, Storage & Pheripherals
Some of the iconic companies from this sector are:

We have also performed a deep dive into one of the industries for the IT sector – Semiconductors & Semiconductor Equipments. Click on the link to read more about this industry!
CONCLUSION
Even though it is scary for the impending arrival of recession, nevertheless, this is part of a business cycle. As we can see from past evidence, after every Bear market, it is always followed by a Bull market. Only the companies that are performing well, in terms of earnings per share, cash flow, etc… will survive this critical period.
Recommended reads:
Should You Invest In Internet & Direct Marketing Retail Industry During Recession?
Should You Invest In Semiconductor Industry During Recession?
DISCLOSURE
The above article is for educational purposes only. Under no circumstances does any information provided in the article represent a recommendation to buy, sell or hold any stocks/asset. In no event shall ViA or any Author be liable to any viewers, guests or third party for any damages of any kind arising out of the use of any content shared here including, without limitation, use of such content outside of its intended purpose of investor education, and any investment losses, lost profits, lost opportunity, special, incidental, indirect, consequential or punitive damages resulting from such unintended use.
